Untuk membantu Anda memilih Master Trader, Bybit menyediakan data kinerja perdagangan terperinci dari setiap Master Trader sebagai referensi. Selain melihat data kinerja dasar semua Master Trader di bagian Master Trader Teratas dan Semua Master Trader di halaman Copy Trading, Anda juga dapat mengeklik kartu Master Trader untuk mengakses halaman portofolio guna melihat data kinerja perdagangan yang lebih komprehensif.
Dalam artikel ini, kita akan melihat lebih dekat data kinerja perdagangan pada laman portofolio Master Trader. Untuk mempelajari lebih lanjut tentang bagaimana Master Trader dapat diberi peringkat di Papan Peringkat Master Trader Teratas, silakan kunjungi di sini.
Harap diperhatikan bahwa kinerja Perdagangan USDT Perpetual dan Bot Perdagangan yang dibuat melalui Copy Trading akan diperhitungkan.
Halaman Portofolio
Ada beberapa bagian di halaman profil Master Trader, termasuk Kinerja Ikhtisar, Profit (Pengikut), Statistik, Statistik Perdagangan Kopi, dan Pengikut.
Sebelum melihat data yang lebih detail, Anda dapat melihat data berikut di bagian atas laman:
|
|
Definisi |
Perbarui Frekuensi |
|
Pengikut |
Jumlah Pengikut Saat Ini |
Waktu Nyata |
|
Hari Perdagangan |
Hari ketika Master Trader memiliki posisi terbuka dan bot yang tercipta |
Pukul 00.00 (tengah malam) UTC Harian |
|
Indeks Stabilitas |
Menggunakan analitik tingkat lanjut, Indeks Stabilitas menilai seberapa baik Master Trader menghadapi volatilitas.
Indeks komprehensif ini menggabungkan berbagai kriteria audit, termasuk saldo dompet, ROI 7H, dan Drawdown Maksimum 30H. |
Pukul 00.00 (tengah malam) UTC Harian |
|
AUM |
Jumlah total yang diinvestasikan oleh semua Pengikut di Master Trader selama 30 hari terakhir. |
Pukul 00.00 (tengah malam) UTC Harian |
|
Total Aset |
Total saldo dompet yang saat ini dipegang oleh Master Trader. |
Waktu Nyata |
Ikhtisar Kinerja
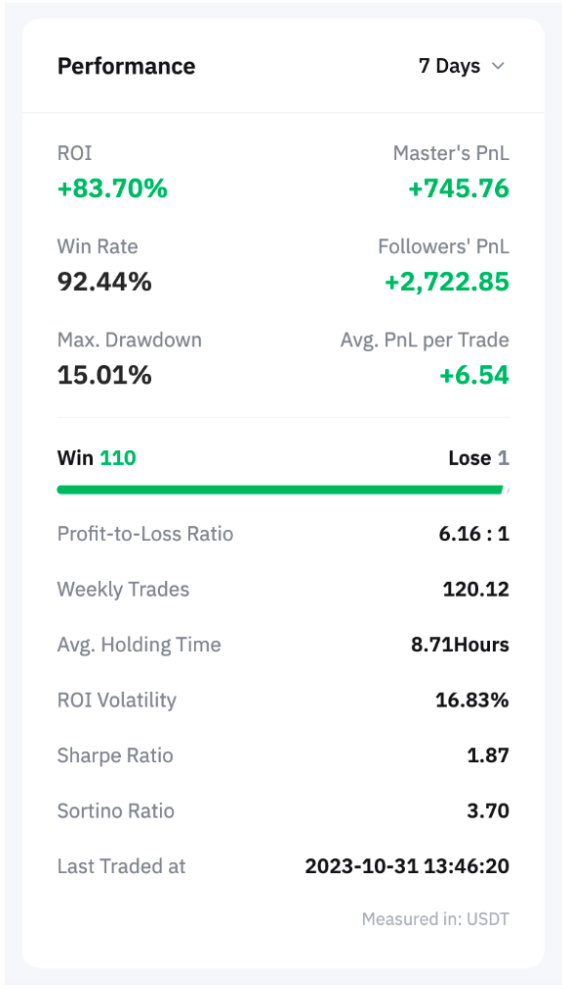
Data berikut dapat dilihat di bagian Ikhtisar Kinerja:
|
|
Definisi |
Frekuensi Pembaharuan |
|
ROI |
Return on investment (ROI) adalah indikator yang digunakan untuk mengevaluasi kinerja investasi.
Silakan merujuk pada aturan-aturan penghitungan untuk ROI di bawah ini untuk mendapatkan informasi selengkapnya.
Formula: Ekuitas Akun = Saldo Dompet + L&R Belum Terealisasi
Saldo Dompet = Jumlah(Saldo Dompet Akun Bot) + Saldo Dompet Akun Master Trader
Jumlah (Saldo Dompet Akun Bot) = Saldo Posisi + Margin untuk Pesanan Tertunda + Sisa Margin
L&R Belum Terealisasi = L&R Belum Terealisasi yang timbul dari posisi yang dipegang dalam Bot Perdagangan dan Perdagangan USDT Perpetual
Deposit Baru = Harga Aset Σ × Jumlah Deposit
Harga Aset = Harga koin pada saat deposit
Profit = L&R Terealisasi + Pendapatan Biaya Pendanaan - Biaya Perdagangan + L&R Belum Terealisasi Saat Ini - L&R Belum Terealisasi Sebelumnya
ROI = Total Profit / (Ekuitas Akun Sebelumnya + Deposit Baru)
Silakan lihat contoh terperinci (*) di bawah ini. |
Pukul 03.00 UTC Setiap Hari |
|
L&R Master |
Total laba yang mencakup L&R terealisasi dan belum terealisasi. |
Waktu Nyata |
|
Tingkat Kemenangan |
Rasio jumlah perdagangan yang menghasilkan laba dengan jumlah total perdagangan tertutup.
Formula Tingkat Menang = (Jumlah Pesanan dengan L&R Tertutup Positif + Jumlah Pesanan dengan L&R Belum Terealisasi Positif) / (Jumlah Total Posisi Tertutup + Total Jumlah Posisi Terbuka)
Catatan: Penghitungan juga mencakup jumlah posisi Bot Perdagangan sesuai yang dibuat melalui Copy Trading. |
Pukul 03.00 UTC Setiap Hari |
|
L&R Pengikut |
Total laba Pengikut di masa lalu dan saat ini, termasuk L&R terealisasi dan belum terealisasi.
Harap diperhatikan bahwa L&R Master Trader dan Pengikut mungkin tidak konsisten karena waktu/harga entri Pengikut dapat bervariasi. |
Waktu Nyata |
|
Drawdown Maksimum |
Drawdown Maksimum (MDD) adalah kerugian maksimum yang belum terealisasi untuk Master Trader dalam sebulan terakhir. MDD rendah menunjukkan bahwa kerugian yang belum terealisasi dari strategi perdagangan Master Trader relatif kecil.
Formula MDD = |Min (ROI di N-Hari− Total ROI di N − 1 Hari)| |
Pukul 03.00 UTC Setiap Hari |
|
Rata-rata L&R per Perdagangan |
Laba dan rugi rata-rata dari semua posisi tertutup yang dimasukkan oleh Master Trader. Nilai yang lebih tinggi menunjukkan bahwa Master Trader telah berkinerja baik dalam hal keuntungan.
Formula Laba Kumulatif / (Jumlah Perdagangan dengan Keuntungan + Jumlah Perdagangan dengan Kerugian) |
Pukul 03.00 UTC Setiap Hari |
|
Rasio Laba-Rugi |
Rasio keuntungan rata-rata per pesanan yang menguntungkan dengan kerugian rata-rata per pesanan yang merugikan selama N hari. |
Pukul 03.00 UTC Setiap Hari |
|
Perdagangan Mingguan |
Rata-rata jumlah perdagangan mingguan yang dilakukan Master Trader dalam N hari terakhir. |
Pukul 03.00 UTC Setiap Hari |
|
Rata-rata Waktu Penahanan |
Periode penahanan posisi rata-rata dari semua posisi tertutup selama N hari. |
Pukul 03.00 UTC Setiap Hari |
|
Volatilitas ROI |
Indikator yang digunakan untuk mengukur stabilitas pendapatan trader, di mana nilai yang lebih tinggi menunjukkan lebih sedikit stabilitas dalam imbal hasil. |
Pukul 03.00 UTC Setiap Hari |
|
Rasio Sharpe |
Ukuran profitabilitas Master Trader dengan mempertimbangkan risiko volatilitas pendapatan, dengan nilai yang lebih tinggi menunjukkan imbal hasil yang lebih baik pada tingkat volatilitas ROI yang sama. |
Pukul 03.00 UTC Setiap Hari |
|
Rasio Sortino |
Ukuran profitabilitas Master Trader dengan mempertimbangkan risiko penurunan pendapatan, dengan nilai yang lebih tinggi menunjukkan imbal hasil yang lebih baik pada tingkat risiko kerugian yang sama. |
Pukul 03.00 UTC Setiap Hari |
|
Terakhir Diperdagangkan di |
Terakhir kali Master Trader membuat pembukaan atau penutupan pesanan |
Waktu Nyata |
Cara Menghitung ROI N-Hari
Contoh
Pada 8 Januari 2023, laba dan rugi belum terealisasi (UPL) Trader B adalah +2.300 USDT, dan hasil perdagangan selama tujuh (7) hari terakhir adalah sebagai berikut:
|
L&R Terealisasi |
Biaya Pendanaan |
Biaya Perdagangan |
|
8.000 |
300 |
400 |
Pada 1 Januari 2023, akun UTA Trader B memiliki aset berikut, beserta UPL +1.200 USDT:
|
Koin |
BTC |
ETH |
USDT |
|
Harga |
27.000 |
1.500 |
1 |
|
Jumlah |
1 |
10 |
9.000 |
Dalam tujuh (7) hari terakhir, aktivitas transfer berikut telah dilakukan melalui UTA:
|
Koin |
BTC |
LTC |
LTC |
|
Jenis |
Transfer Masuk |
Transfer Masuk |
Transfer Keluar |
|
Jumlah |
2 |
120 |
70 |
|
Harga pada saat transaksi |
28.000 |
75 |
85 |
Perhitungan ROI 7H Trader B adalah sebagai berikut:
Ekuitas Akun Sebelumnya = 27.000 × 1 + 1.500 × 10 + 9.000 + 1.200 = 52.200
Deposit Baru = 28.000 × 2 + 75 × 120 = 65.000
Laba = 8.000 - 300 − 400 + 2.300 − 1.200 = 8.400
ROI = 8.400 / (52.200 + 65.000) = 7,17%
Laba (Pengikut)
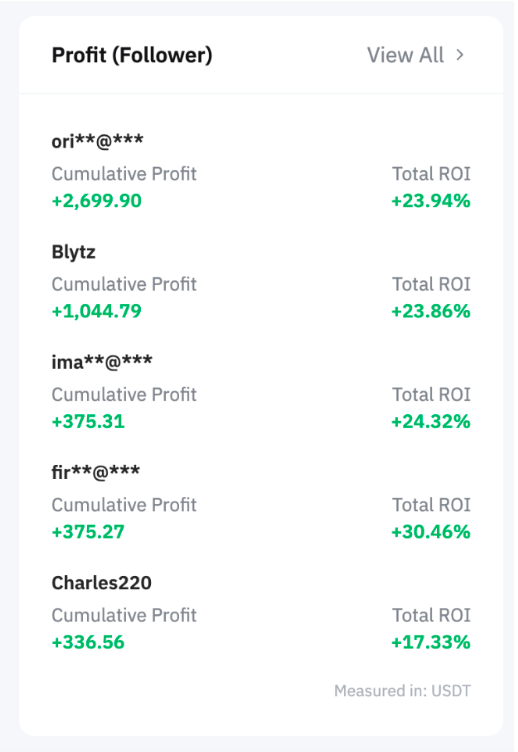
Setelah Pengikut mulai mengikuti Master Trader, kinerjanya akan ditampilkan di bagian ini secara waktu nyata. Laba Kumulatif dan Total ROI akan diperbarui pada pukul 00.00 UTC (tengah malam) setiap hari.
Statistik
Pada tab Statistik, ada opsi yang dapat dipilih — Semua, Perdagangan, dan Bot.
-
Perdagangan mencakup data perdagangan, termasuk informasi tentang perdagangan saat ini dan perdagangan tertutup.
-
Bot merujuk pada data bot, termasuk detail tentang bot saat ini dan bot yang dihentikan.
Tiga (3) jenis data tersedia di sini, termasuk Riwayat Pendapatan, Laba, dan Perdagangan.
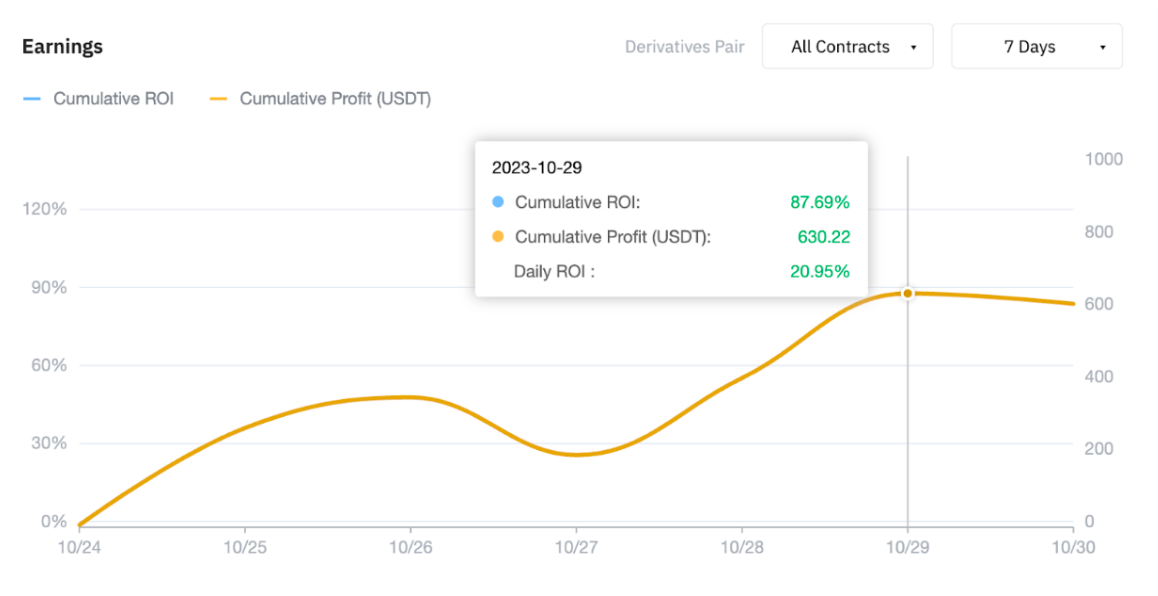
Pendapatan
|
|
Definisi |
Perbarui Frekuensi |
|
ROI Kumulatif |
Lihat metode penghitungan yang diperinci dalam penghitungan ROI pada Ikhtisar Kinerja yang ditunjukkan di atas, yang mengikuti pendekatan yang sama.
|
Pukul 00.00 (tengah malam) UTC Harian |
|
Laba Kumulatif (USDT) |
L&R Terealisasi Kumulatif + L&R Belum Terealisasi untuk posisi yang ada di Perdagangan USDT Perpetual dan bot perdagangan | |
|
ROI Harian |
Lihat metode penghitungan yang diperinci dalam penghitungan ROI pada Ikhtisar Kinerja yang ditunjukkan di atas, yang mengikuti pendekatan yang sama.
|
Harap diperhatikan bahwa grafik untuk ROI Kumulatif dan Laba Kumulatif diperbarui setiap jam.
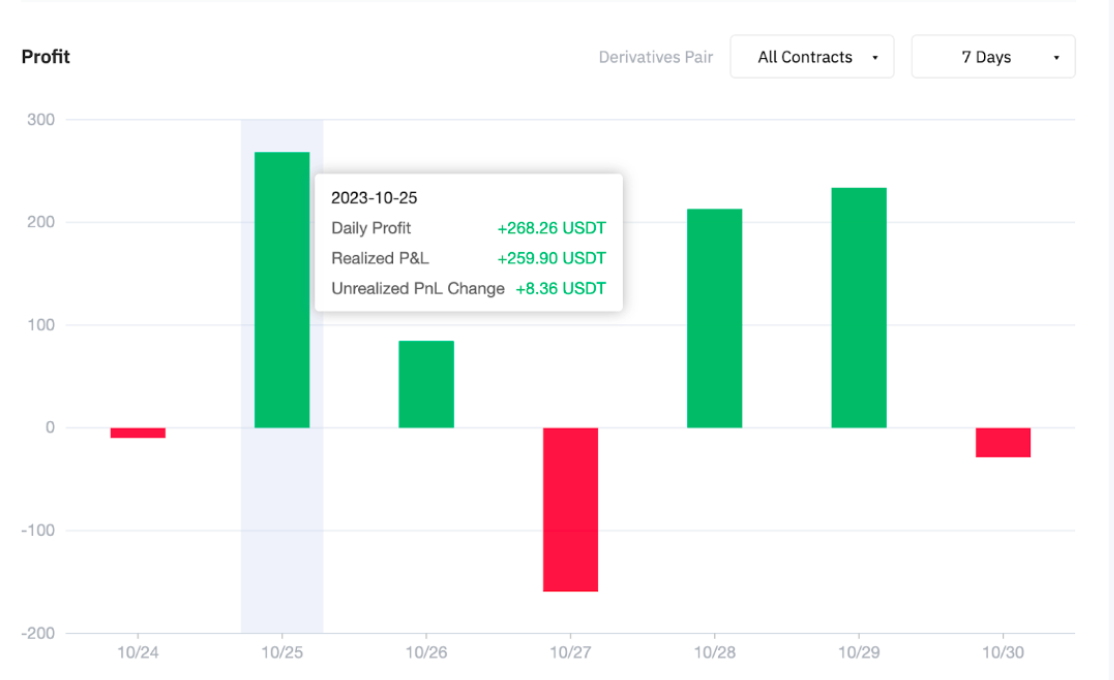
Keuntungan
|
|
Definisi |
Frekuensi Pembaharuan |
|
Keuntungan Harian |
L&R Terealisasi Harian + Perubahan L&R Belum Terealisasi |
Pukul 00.00 (tengah malam) UTC Harian |
Riwayat Perdagangan
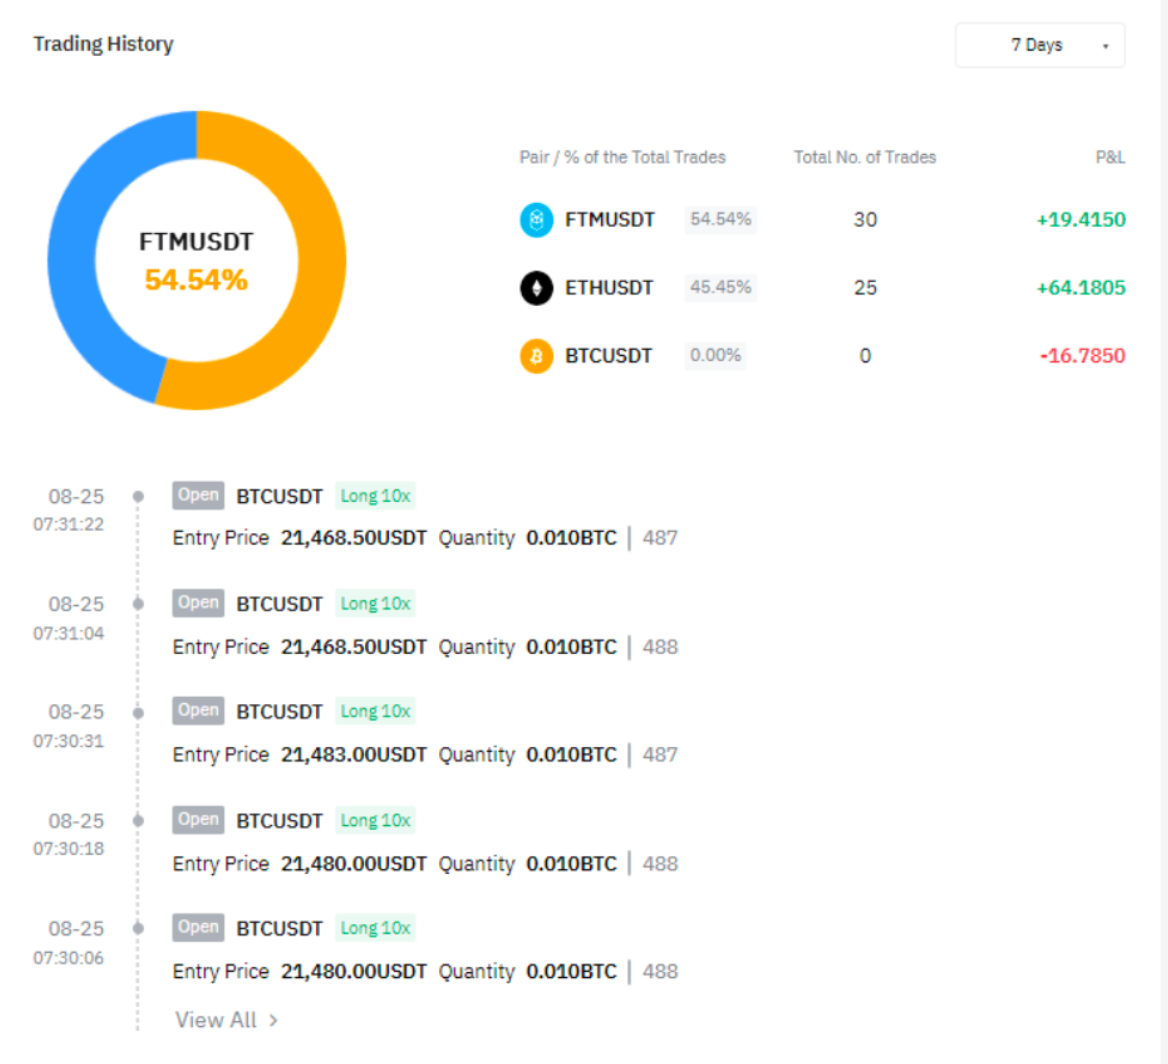
Pasangan/% dari Total Perdagangan, Total Jumlah Perdagangan, dan L&R dalam Riwayat Perdagangan akan diperbarui pada pukul 00.00 (tengah malam) setiap hari. Selain itu, setiap transaksi yang dimulai oleh Master Trader akan ditampilkan di bagian ini secara waktu nyata. Harap diperhatikan bahwa hanya Riwayat Perdagangan USDT Perpetual yang akan ditampilkan di sini.
|
|
Definisi |
Frekuensi Pembaharuan |
|
Pasangan/% dari Total Perdagangan |
Jumlah Perdagangan Kontrak Masing-masing / Total Jumlah Perdagangan dalam N hari. |
Pukul 00.00 (tengah malam) UTC Harian |
|
Total Jumlah Perdagangan |
Total Jumlah posisi yang telah dibuka Master Trader dalam N hari. | |
|
L&R |
Total laba dan rugi dari semua posisi tertutup untuk masing-masing simbol dalam N hari. |
Perdagangan
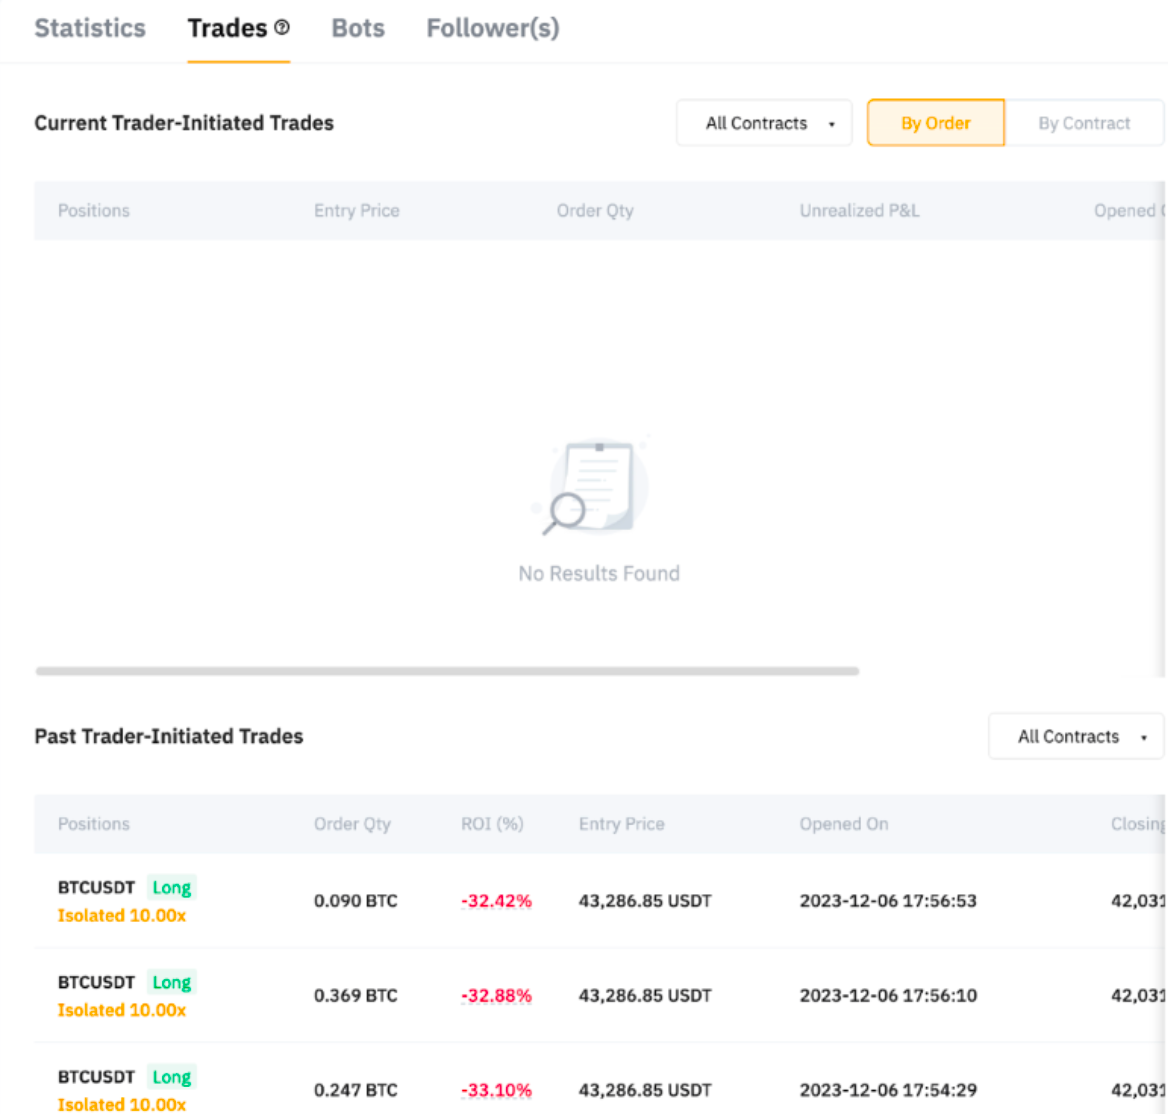
Anda dapat mengakses detail perdagangan saat ini dan sebelumnya dalam Perdagangan USDT Perpetual. Data spesifik yang dapat dilihat adalah sebagai berikut:
Perdagangan yang Diprakarsai Trader Saat Ini: Posisi, Harga Entri, Margin, Kuantitas Pesanan, Dibuka pada, TP/SL, dan L&R Belum Terealisasi.
Perdagangan yang Diprakarsai Trader Sebelumnya: Posisi, Kuantitas Pesanan, Harga Entri, Dibuka pada, Harga Penutupan, Ditutup pada, Margin, ROI (%), dan Pengikut.
Harap diperhatikan bahwa posisi Pengikut mungkin tidak selalu cocok dengan Master Trader Anda karena beberapa alasan. Untuk mendapatkan informasi selengkapnya, silakan lihat di sini.
Bot
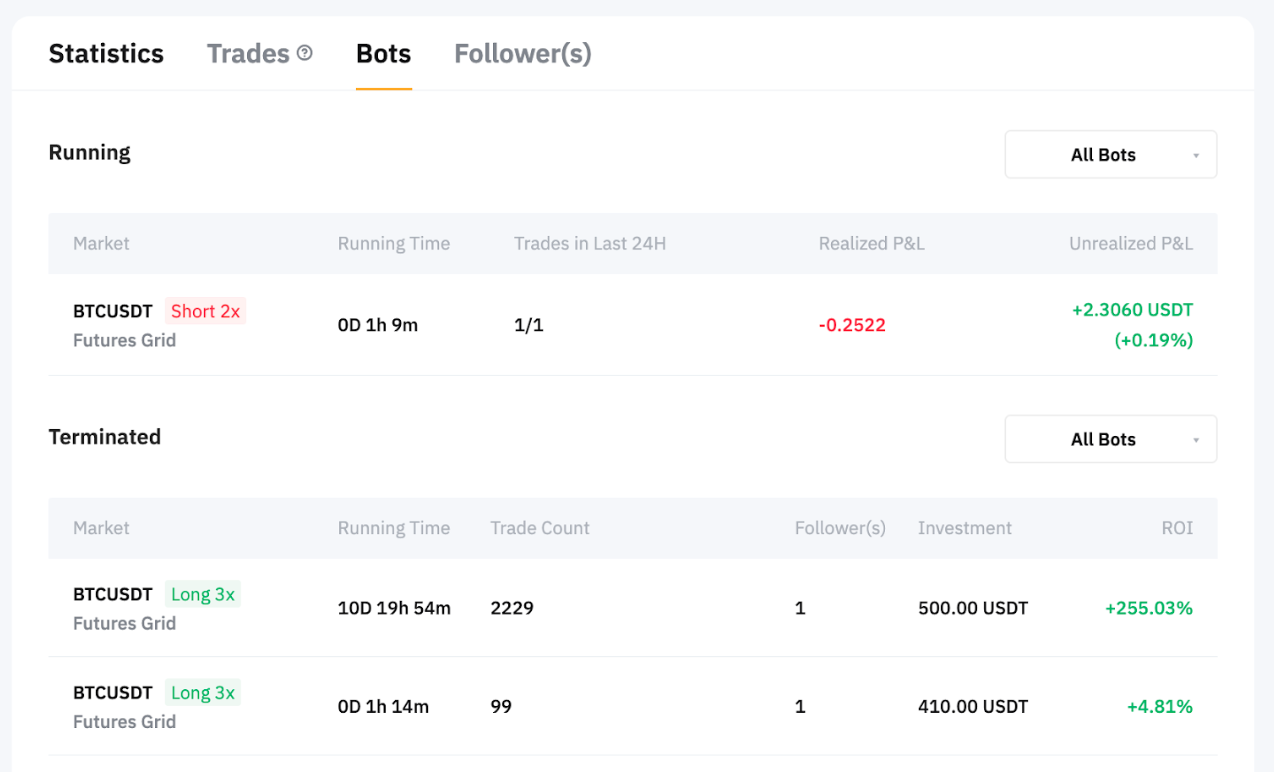
Anda dapat mengakses detail bot yang berjalan dan dihentikan di Bot Perdagangan. Data spesifik yang dapat dilihat adalah sebagai berikut:
Berjalan: Pasar, Waktu Operasi, Perdagangan dalam 24 jam terakhir, L&R Terealisasi, L&R Belum Terealisasi
Dihentikan: Pasar, Waktu Operasi, Hitungan Perdagangan, Pengikut, Investasi, ROI
Harap diperhatikan bahwa Pengikut mungkin tidak selalu memiliki jumlah bot yang sama dengan Master Trader Anda karena beberapa alasan. Untuk mendapatkan informasi selengkapnya, silakan lihat di sini.
Pengikut
Pada bagian ini, Anda dapat melihat detail Pengikut Master Trader:
|
|
Definisi |
Frekuensi Pembaharuan |
|
ID Pengguna |
− |
− |
|
Biaya Kumulatif |
Margin kumulatif yang diperlukan untuk menyalin perdagangan yang diprakarsai oleh Master Trader ini. |
Pukul 00.00 (tengah malam) UTC keesokan harinya |
|
Total Keuntungan Diterima |
Total keuntungan yang diperoleh dari copy trade yang diprakarsai oleh Master Trader ini. |
Pukul 00.00 (tengah malam) UTC keesokan harinya |
|
Total ROI (Pengikut) |
Total keuntungan dari copy trade yang diprakarsai oleh Master Trader/Margin kumulatif yang diperlukan untuk menyalin perdagangan ini |
Pukul 00.00 (tengah malam) UTC keesokan harinya |
|
Hari Mengikuti |
Jumlah hari sejak Anda mengikuti Master Trader ini. |
Pukul 00.00 (tengah malam) UTC Harian |
Penafian:
Kinerja Master Trader sebelumnya bukan jaminan imbal hasil di masa mendatang. Penting bagi trader untuk mengakui bahwa semua investasi memiliki risiko bawaan sebelum terlibat dalam Copy Trading. Pengguna harus bertanggung jawab penuh untuk memahami dan menerima risiko ini sebelum memulai aktivitas perdagangan apa pun.
